Video: Click here to see a video that discusses this page of the Chart Display’s Display Wizard. This video is available through the Platform Learning Center in the CorasWorks Customer Center.
As a builder, you can enable or disable several options that allow the end user to customize a chart to show exactly the information they want to see. These properties are set on the User Display Settings page.
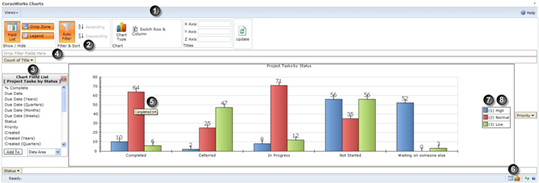
The topics below explain the purpose of each property on this page. The numbers to the right of each property name correspond to the numbers in the figure below, which shows how each property affects the user interface when enabled.

Show the chart ribbon (toolbar) above the chart
(Available only when Show ribbon is selected) Show the Auto Filter icon in the ribbon above the chart. Auto filter allows the end user to apply or remove filtering that is set in Static Configuration, Chart Designer settings, and/or the Filter Drop Zone of the user interface.
Show all of the fields (columns) that the builder identified on the Columns page of the Display Wizard. This field list is displayed to the left of the chart.
Show an area where the end user can drag and drop columns to add more data to the chart or apply a filter. The filter identified by the builder on the Filter page is not affected.
When the user hovers over a column/pie slice/data point on the chart, show a popup that states the underlying value.
Show a pair of icons at the bottom of the Chart Display that allows the end user to switch back and forth between the chart and a grid-style view of the underlying data.
Include a legend in the display.
(Available only when Show legend is selected.) The location of the legend. This defaults to Right.